Help Center

Boston Consulting Group (BCG) Growth-Share Matrix

Boston Consulting Group (BCG) Growth-Share Matrix Nov 27, 2023

The Boston Consulting Group (BCG) Growth-Share Matrix is an exceptional tool that has proven its effectiveness over time. Designed in the early 1970s by the Boston Consulting Group, this matrix has grown to be indispensable for companies looking to properly distribute resources and maintain a balance in their product offerings. We'll explore the fundamentals, applications, and constraints of the BCG Growth-Share Matrix in this blog post, along with providing a real-world example.

What is the Boston Consulting Group (BCG) Growth-Share Matrix?

Bruce Henderson, the creator of Boston Consulting Group (BCG), created the Growth-Share Matrix, a strategic framework tool that aids companies in examining their product line. Products are categorized into four quadrants by the matrix based on their market share and growth rate: Stars, Question Marks, Cash Cows, and Dogs. Items with rapid growth and substantial market share are denoted by stars; those with slow growth and minimal share are denoted by question marks; cash cows symbolize high growth and low share; and dogs symbolize low growth and low share. Businesses use the matrix to guide resource allocation and business strategy decisions to optimize their overall profitability and competitiveness in the market.

Understanding the BCG Growth-Share Matrix

The BCG Growth-Share Matrix evaluates a company's product portfolio by plotting products on a grid based on market growth and relative market share. It classifies products into four categories:
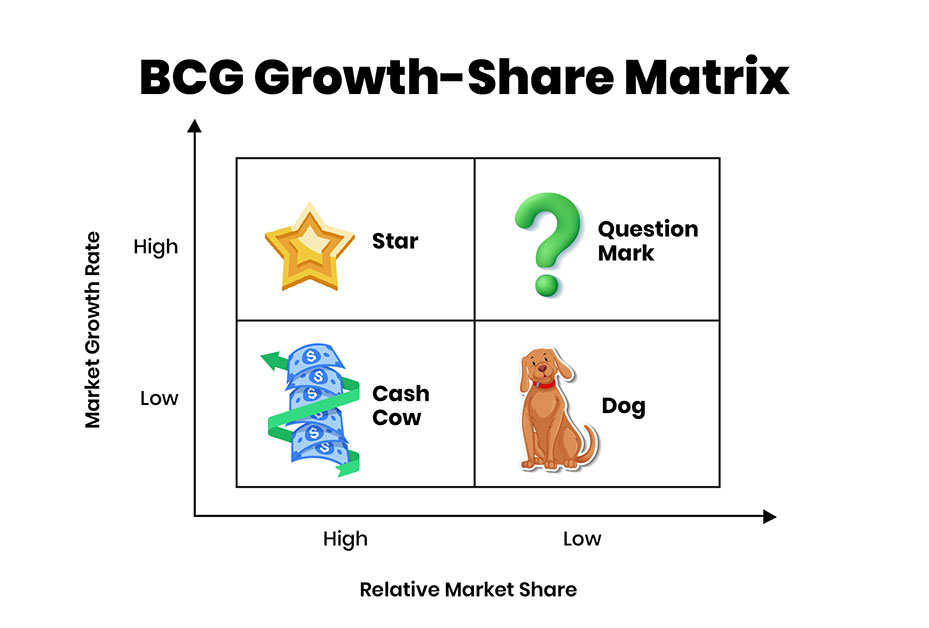
BCG Growth-Share Matrix
  • Stars: Products or divisions placed in the high relative market share; or high market growth quadrant are labelled as stars. These are usually the companies' growth engines, and maintaining and improving their market position requires large investments.
  • Cash Cows: Cash cows are well-known products with substantial market shares that are situated in the low market growth and high relative market share quadrant. These items have a high-profit margin and require little capital to maintain their market share.
  • Question Marks: Question marks indicate products that have the potential to expand but do not yet hold a sizable market share. They are positioned in the high market growth, low relative market share quadrant. To decide on their future action, these need to be carefully considered and investment decisions made.
  • Dogs: Products or business units that fall into the low relative market share and low market growth quadrants are categorized as dogs. They may not yield significant returns and usually have a restricted potential for expansion. Whether to retain, harvest, or sell these assets requires strategic decision-making.

Thus, the BCG Matrix offers a visual representation of an organization's portfolio, assisting in the formulation of strategic framework choices about the distribution of resources, investments, and divestitures.

Limitations in points of BCG Matrix

  • Static View: To ignore the quick changes and dynamic nature of the business environment, the matrix takes a static perspective of markets and goods. A business strategy can miss the real potential of a product or business unit in today's fast-moving marketplace.
  • Market Growth as Sole Indicator: The strategic framework analysis may be simplified if it depends only on relative market share and market growth. A thorough strategic evaluation must take into account additional important variables like customer preferences, technological advancements, and competition.
  • Assumption of Market Leadership: The matrix disregards the potential for creative or niche businesses to successfully compete in smaller markets and instead assumes that market leadership is directly connected with profitability.
  • Neglect of Synergies: The BCG Matrix often neglects the potential synergies between different products or business units within an organization. It may lead to missed opportunities for leveraging synergies and optimizing resource allocation.

Example of a BCG Growth Matrix

Consider the following scenario for a technological company:

  • Stars: This includes the company's most recent offering, a state-of-the-art smartphone. It requires ongoing investment to maintain its existing position because of its substantial market share and quick market expansion.
  • Cash Cows: This quadrant includes the well-known laptop line of the corporation, which commands a significant market share in a steady market. With little investment required, these goods consistently produce cash flow.
  • Question Marks: The company's new virtual reality offering is undefined. It needs strategic investment and currently has a small market share, despite showing promise in a developing industry.
  • Dogs: Tablets from the previous generation are in the dog's quadrant because of their diminishing sales in a crowded market. Choosing which to invest in, harvest, or sell off to revive the product is a strategic decision.

Conclusion

An organization's product or business unit portfolio can be visually represented, which helps with resource allocation, investment prioritization, and long-term planning. To guarantee a thorough and flexible business strategy, companies must be aware of the matrix's limitations and utilize it in concert with other business strategy frameworks. The BCG Growth-Share Matrix serves as a trustworthy compass for businesses navigating the intricacies of today's marketplaces, assisting them in setting out on a path toward long-term success and growth.

X
The Strategy Institute

CredBadge™ is a proprietary, secure, digital badging platform that provides for seamless authentication and verification of credentials across digital media worldwide.

CredBadge™ powered credentials ensure that professionals can showcase and verify their qualifications and credentials across all digital platforms, and at any time, across the planet.

The Strategy Institute

Verify A Credential

Please enter the License Number/Unique Credential Code of the certificant. Results will be displayed if the person holds an active credential from TSI.


Stay Informed!

Keep yourself informed on the latest updates and information about business strategy by subscribing to our newsletter.


Subscribe